Corporate Governance Portfolio Strategy
Analyzing the impact of corporate governance issues on stock returns. Our backtests show that screening out companies with governance concerns generates significant outperformance over the market.
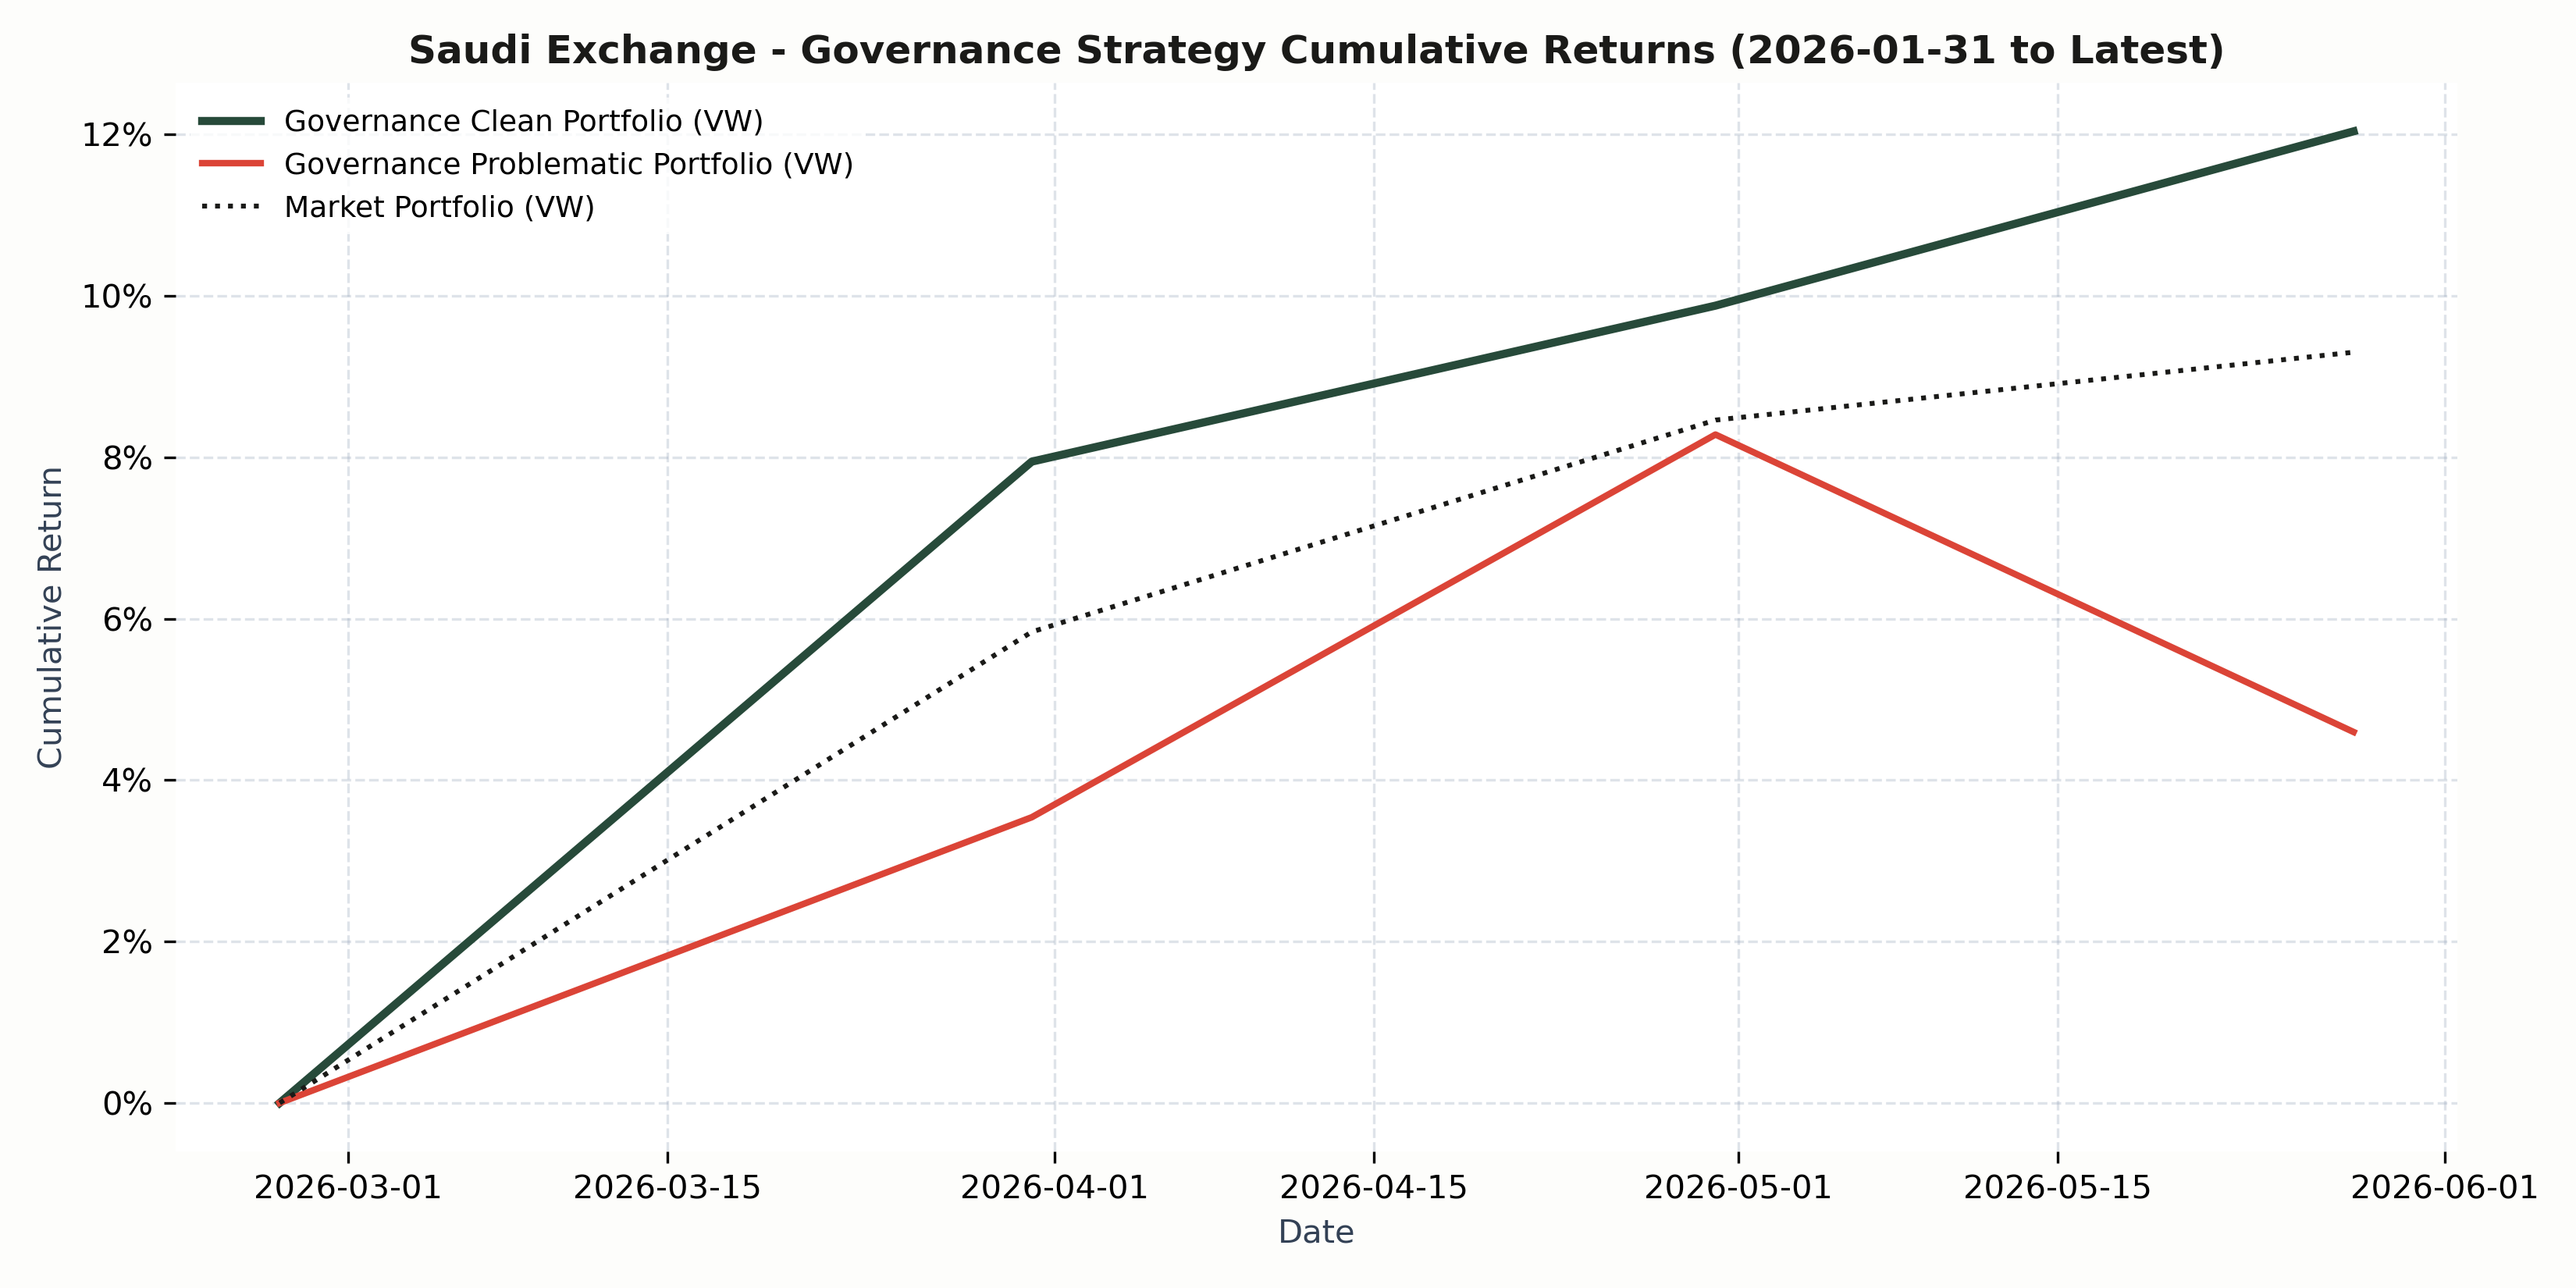
Cumulative Returns (Rebalanced Monthly)
Strategy Metrics
Rebalanced monthly.
Top 10 Portfolio Holdings
Value-weighted holdings as of latest rebalancing date: April 30, 2026
| # | Ticker | Company | Portfolio Weight | Price (SAR) | Governance |
|---|---|---|---|---|---|
| 1 | 2280 | ALMARAI | 24.65% |
46.10 | B |
| 2 | 8210 | BUPA ARABIA | 16.31% |
171.70 | A |
| 3 | 4100 | MCDC | 9.56% |
89.75 | A |
| 4 | 4164 | NAHDI | 8.13% |
98.45 | B |
| 5 | 8230 | ALRAJHI TAKAFUL | 6.62% |
105.90 | A |
| 6 | Ticker Locked | Sign In to Unlock | 6.53% |
151.00 | A |
| 7 | Ticker Locked | Sign In to Unlock | 4.97% |
16.80 | A |
| 8 | Ticker Locked | Sign In to Unlock | 3.56% |
4.93 | B |
| 9 | Ticker Locked | Sign In to Unlock | 2.68% |
25.82 | B |
| 10 | Ticker Locked | Sign In to Unlock | 2.63% |
120.40 | A |
Governance Issues Distribution
Analysis of governance oversight failures across the active investment universe.
Companies Affected (%)
Total Issues Count
Methodology & Strategic Rationale
1. Construction of the Governance Signal
We construct the governance signal by systematically compiling and scoring all publicly available regulatory filings. Each governance event is classified into one of five core agency conflict categories: Asset Risk, Information Asymmetry, Tunneling, Entrenchment, and Propping. The issues are assigned a significance score ranging from 1 to 10 based on the severity of the oversight failure and its potential to destroy shareholder value.
2. Portfolio Segmentation & Rebalancing
At the end of each calendar month, the investable universe is partitioned into portfolios based on relative governance scores. The Clean Portfolio (VW) comprises companies with A or B relative ratings (representing the top 40% of the market). The Problematic Portfolio (VW) comprises companies with C, D, or F relative ratings (representing the bottom 60% of the market). To isolate corporate governance factors and prevent extreme concentration risk, state-owned enterprises and government-involved companies are excluded from the backtesting universe. Portfolios are value-weighted by float-adjusted market capitalization to reflect institutional feasibility. To prevent look-ahead bias, financial statement disclosures are aligned using exact report filing dates from the company snapshots. Returns are calculated using split- and dividend-adjusted closing prices, representing total shareholder return.
3. Rationale: The Cost of Weak Governance
Empirical backtesting demonstrates a significant performance spread between clean and problematic firms. Weak corporate governance manifests in value-destroying activities such as tunneling (value extraction by major shareholders), entrenchment (inefficient management insulation), and information asymmetry (withholding critical disclosures). Over the backtest period, screening out companies with active governance concerns generated substantial outperformance. The monotonic decay in returns as governance issues accumulate highlights the critical importance of incorporating governance risk as a core factor in Saudi equity portfolios.
Get Monthly Rebalancing Updates
If you want to be updated about the portfolio rebalance every month, create an account and sign up for our newsletter to receive notifications, trade logs, and governance updates.
Create Account & Sign Up