Saudi Mutual Fund Market:
A Guide to Diversification
215 funds. 10 years of data. How investors can achieve true portfolio diversification using the funds currently offered in the Saudi market.
The State of Fund Diversification
The Saudi mutual fund market has grown significantly, offering investors access to local, regional, and global asset classes. The question for investors: how can one achieve true portfolio diversification using the current fund offerings?
We analyzed 215 open-ended mutual funds offered by asset managers in the Saudi market, requiring at least three years of weekly return data from 2015 to 2026. The data reveals that holding multiple funds does not inherently guarantee diversification.
The Illusion of Choice
The top 30 domestic equity funds by AUM share an average pairwise correlation of 0.77. In practical terms, they move together. Holding five domestic equity funds from five different managers provides redundancy, not diversification.
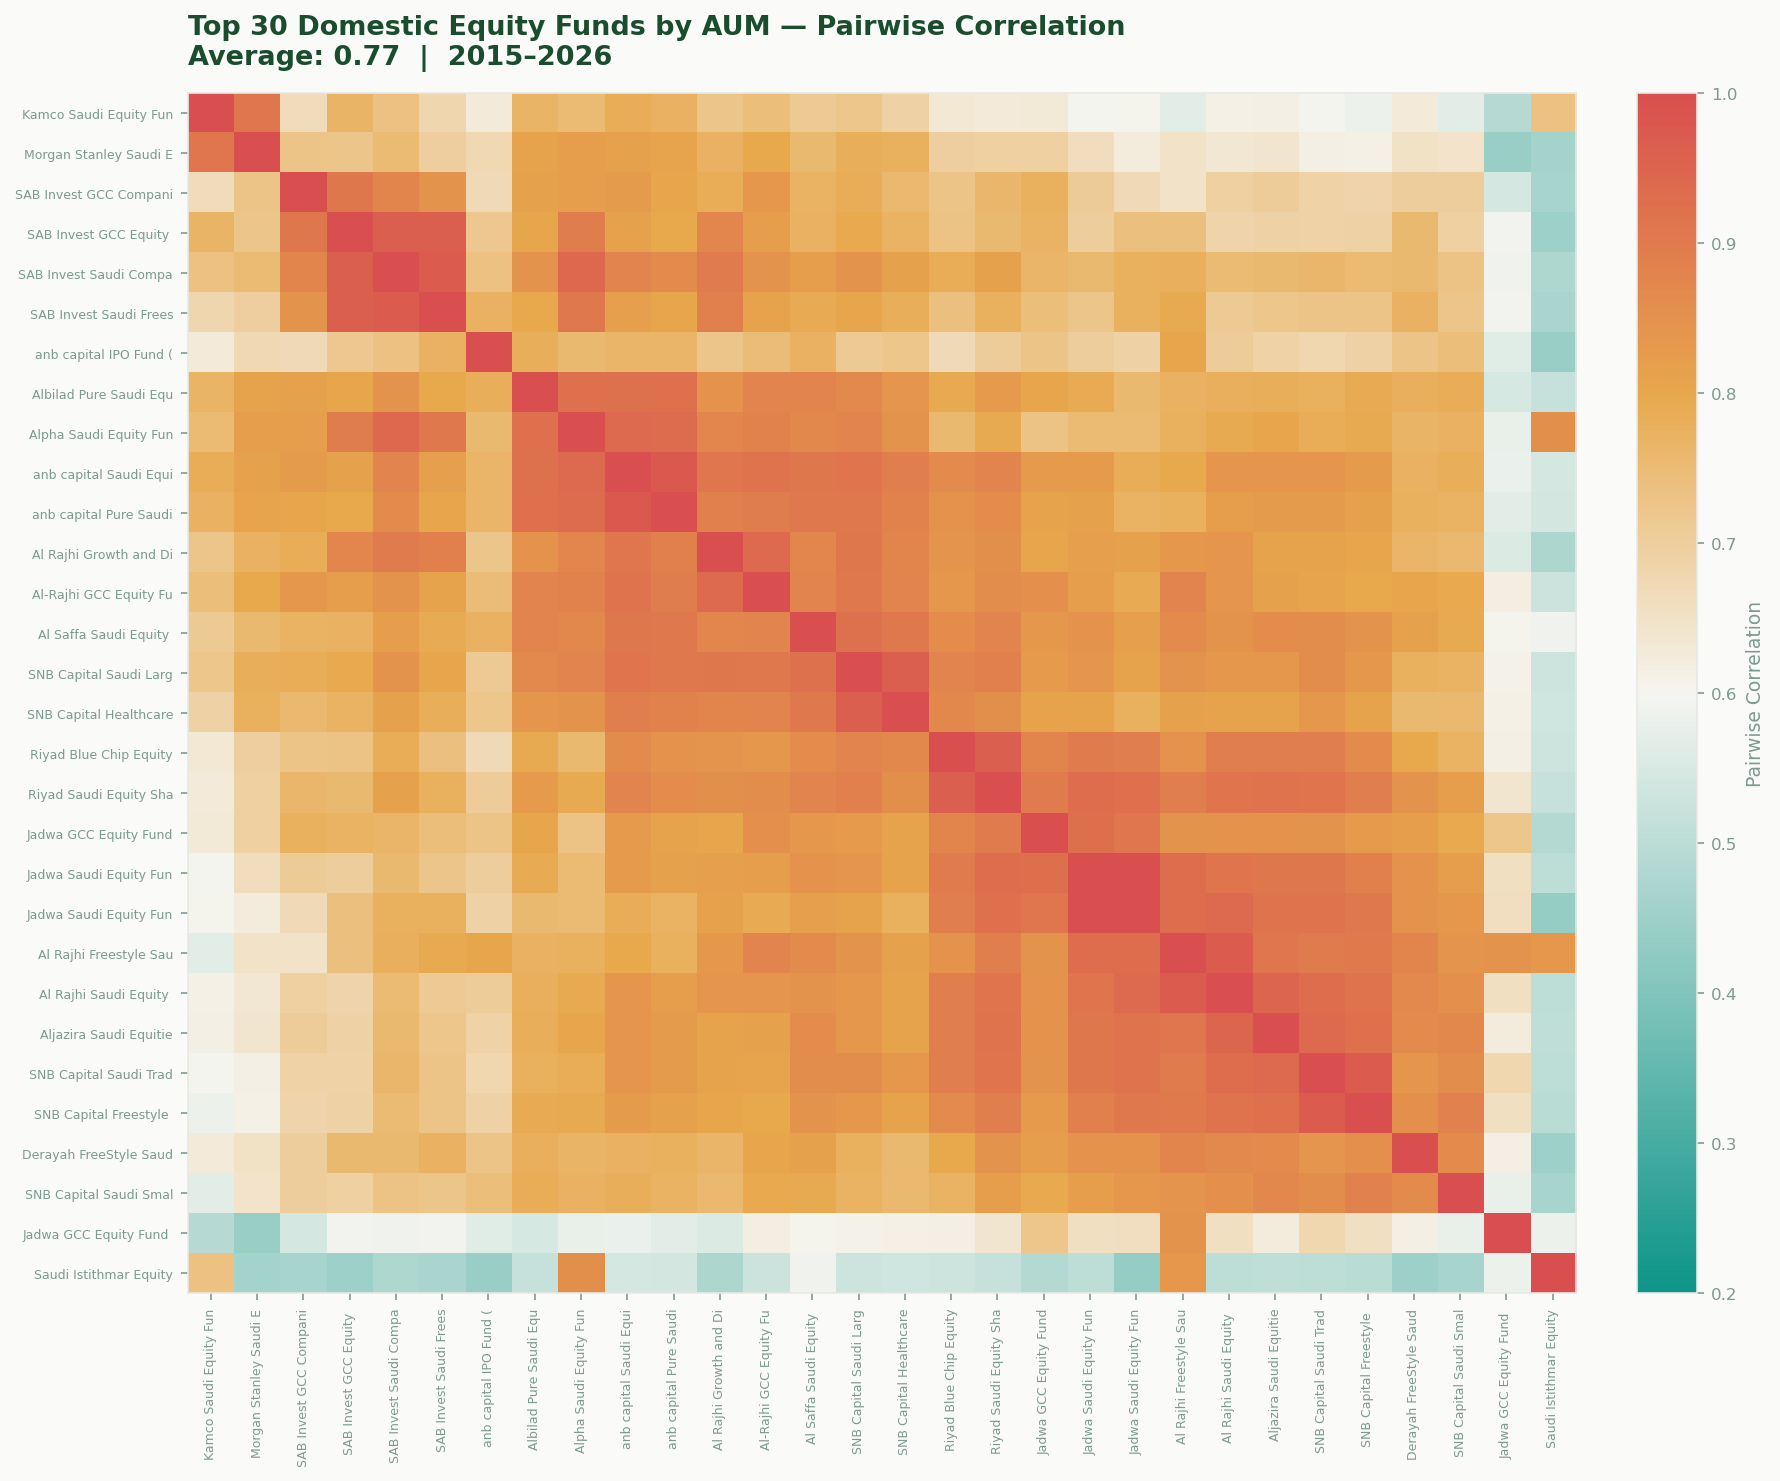
The heatmap above illustrates this. Ordered by hierarchical clustering, the funds form tight blocks of orange and red. A few outliers exist at the edges, such as regional and small-cap funds that deviate from the pack. However, the core of the domestic equity fund market behaves as a single trade.
When Diversification Fails
Correlations between assets tend to increase during market downturns. We tested this in the Saudi fund market by splitting our sample into up-market weeks (top 25% of market returns) and down-market weeks (bottom 25%).
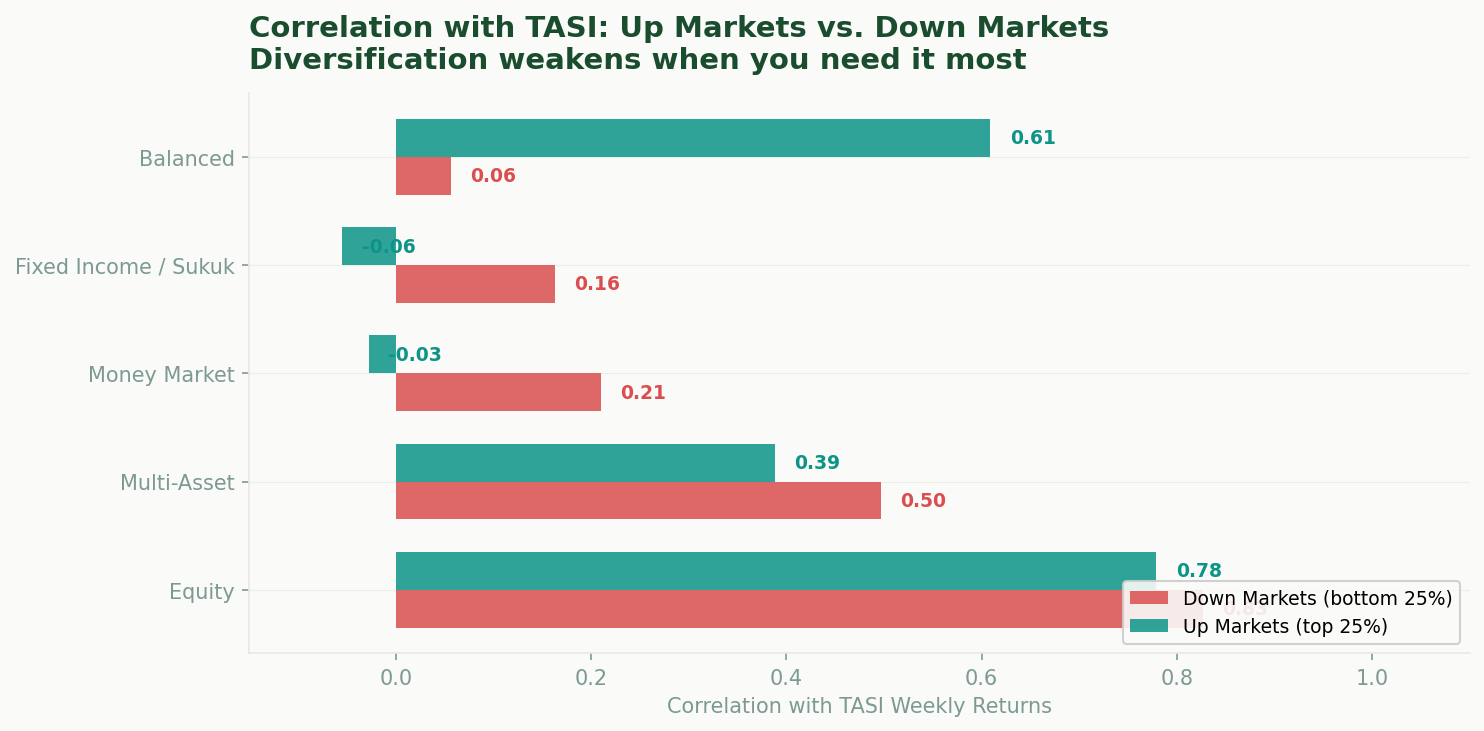
Equity funds show a correlation of 0.79 with the broad market in up weeks, rising to 0.84 in down weeks. Multi-asset funds follow a similar pattern. Money market and fixed income funds show near-zero correlation, as they are different asset classes entirely. Within equities, the dominant market factor persists during a downturn.
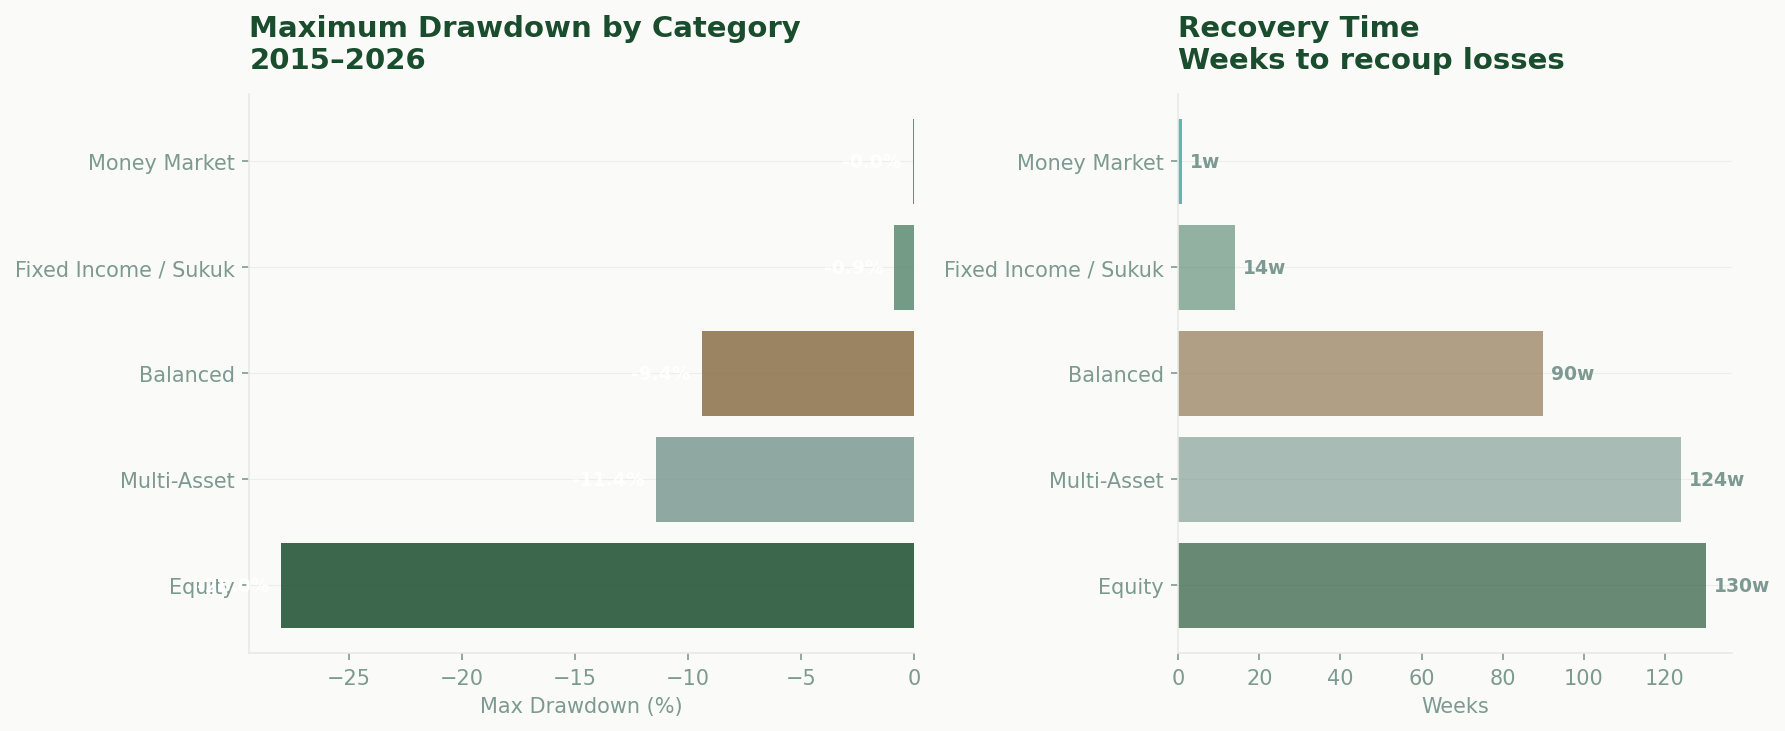
| Category | Max Drawdown | Recovery | Total Return |
|---|---|---|---|
| Equity | -36.3% | 240 weeks | +121.4% |
| Balanced | -16.8% | 90 weeks | N/A |
| Multi-Asset | -14.9% | 103 weeks | N/A |
| Fixed Income / Sukuk | -7.2% | N/A | +17.1% |
| Money Market | -0.8% | 18 weeks | +31.0% |
The Equity Diversification Ceiling
To test if careful fund selection can reduce correlation, we built minimum-correlation equity baskets of increasing size using a greedy algorithm that selects each additional fund to minimize the portfolio's average pairwise correlation.
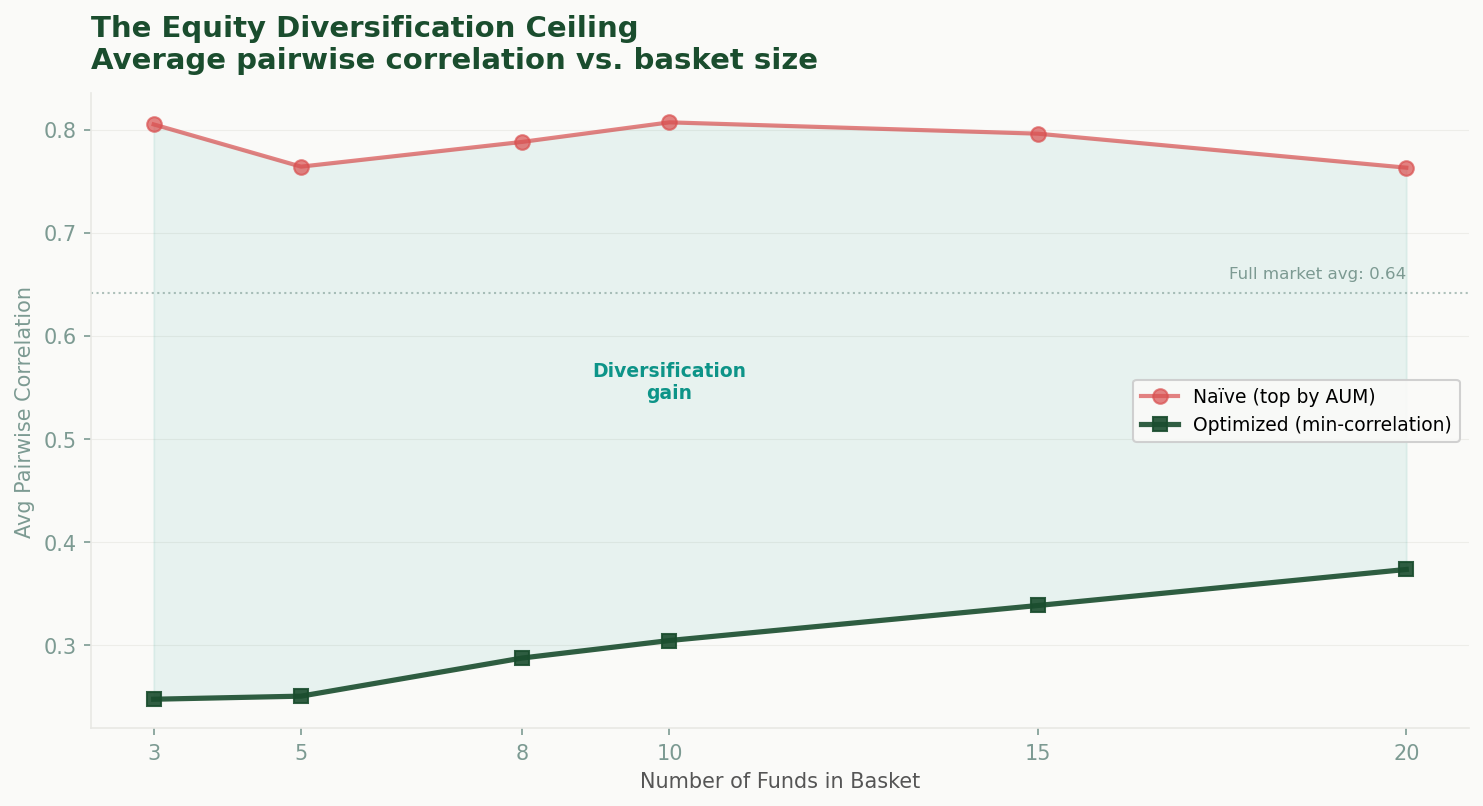
Two findings stand out. First, an optimized 5-fund basket achieves an average correlation of 0.25, compared to 0.76 for a top-5 by AUM. Buying the largest funds provides minimal diversification benefit. Second, as the basket grows, even optimized selection converges toward 0.37. Full diversification requires stepping outside the equity category.
Why Optimize for Correlation Instead of Returns?
When building a basket of funds, it can be tempting to select those with the highest historical returns. However, past performance is famously difficult to project into the future. In contrast, the correlation between different markets is structurally much more stable over time. By optimizing for low correlation, we focus on genuine diversification—ensuring the portfolio includes assets that react differently to economic events, rather than simply concentrating risk in recent top performers.
Building a Smarter Equity Portfolio
The funds that provide this diversification rely on geographic and sector tilts. The optimized baskets selected by the algorithm include:
| # | Fund | Diversification Role |
|---|---|---|
| The 5-Fund Core Basket (Equal Weight: 20% Each) | ||
| 1 | Jadwa Saudi Equity Fund | Core Saudi large-cap exposure |
| 2 | SNB Capital China Equity Fund | Uncorrelated China market exposure |
| 3 | Saudi Financial Institutions Equity Fund | Sector-specific: financial services tilt |
| 4 | Yaqeen IPO Fund | Early-stage, newly listed company exposure |
| 5 | Aljazira Japanese Equities Fund | Uncorrelated Japanese market exposure |
| Expanded 10-Fund Basket (Equal Weight: 10% Each) | ||
| 6 | Saudi Istithmar Equity Fund | Active domestic multi-cap exposure |
| 7 | Riyad Global Equity Sharia Fund | Broad global market exposure |
| 8 | Comprehensive Equity Fund | Diversified sector approach |
| 9 | Aljazira European Equities Fund | Uncorrelated European market exposure |
| 10 | Riyad Gulf Equity Fund (ex-Saudi) | Regional GCC exposure outside Saudi |
The algorithm assumes a simple equal-weight allocation (20% per fund for the 5-fund basket, 10% for the 10-fund basket) and selects structurally different exposures. The core 5-fund basket relies heavily on international markets (China and Japan), a sector-specialist, and an IPO fund. When expanding to 10 funds, the algorithm continues to seek geographic or structural differentiation, adding European equities, GCC ex-Saudi, and broad global equity funds, rather than piling on redundant domestic managers.
The Investor's Rule of Thumb
Before adding an equity fund to a portfolio, investors should consider if the fund provides exposure to a different market, sector, or asset segment. Adding another domestic large-cap equity fund, regardless of the manager, increases correlation. One domestic equity fund provides sufficient local large-cap exposure. The remaining allocations can target international, sector-specific, or thematic strategies.
What This Means for Your Portfolio
Fund Volume Does Not Guarantee Diversification
While the Saudi fund market offers hundreds of products, holding multiple funds does not inherently provide diversification. The data indicates that domestic equity funds remain highly correlated.
Prioritize Asset Allocation Over Manager Selection
Holding multiple domestic equity funds from different managers yields an average correlation of 0.76. In contrast, combining a single domestic fund with international and sector-specific offerings reduces the correlation to 0.25, demonstrating that true diversification stems from varying underlying market exposure.
The Role of International Funds
China, Japan, European, and global equity funds offered by local managers provide structurally uncorrelated returns, making them effective diversification tools within the Saudi fund ecosystem.
The Equity Diversification Ceiling
Even with optimal fund selection, equity-only diversification faces a lower bound around a 0.37 correlation. To achieve further portfolio protection, investors must allocate to structurally different asset classes, such as fixed income or money markets.
Build Better Portfolios
Usool Research provides institutional-grade data on Saudi mutual funds, allowing you to track performance, holdings, and risk metrics across the entire market.
Sign up free to access the full platform.
Start Exploring →Look for value. Cut through the noise.
Methodology & Sources
- Data window: January 2015 to March 2026 (584 weeks). Funds with fewer than 3 years of data excluded.
- Returns: Weekly returns computed from daily NAV per unit, resampled to Thursday close (Saudi trading week). Category-level returns are AUM-weighted.
- Correlation: Pearson pairwise correlation on weekly returns. Hierarchical clustering via Ward's method.
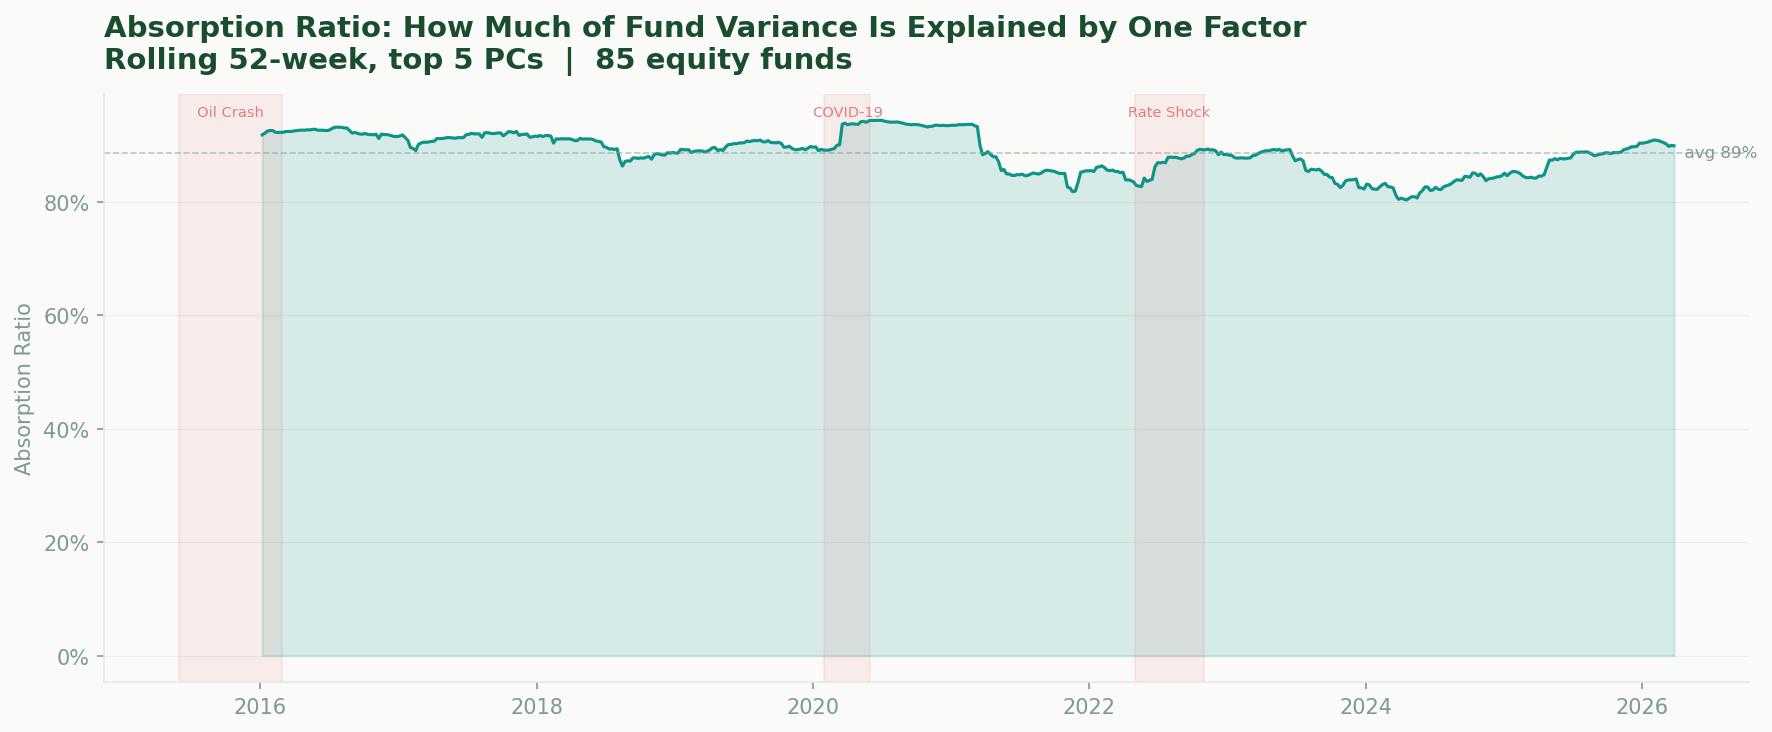
- PCA / Absorption Ratio: Rolling 52-week PCA on 85 equity funds. AR = variance explained by top 5 principal components.
- Crisis correlations: Quartile split on weekly market returns.
- Equity ceiling: Greedy minimum-correlation basket selection. For each basket size N, iteratively selects the fund that minimizes average pairwise correlation.
Important Disclaimer
This article is for informational and educational purposes only. It does not constitute investment advice, a recommendation, or an offer to buy or sell any financial instrument. The portfolio weights presented are the output of an academic model and should not be interpreted as a specific investment recommendation. Past performance is not indicative of future results. All investors should conduct their own due diligence and consult with a licensed financial advisor before making investment decisions. Usool Research is not licensed by the Capital Market Authority (CMA) to provide investment advisory services.